Life Expectancy in U.S. vs Life Expectancy in Zimbabwe
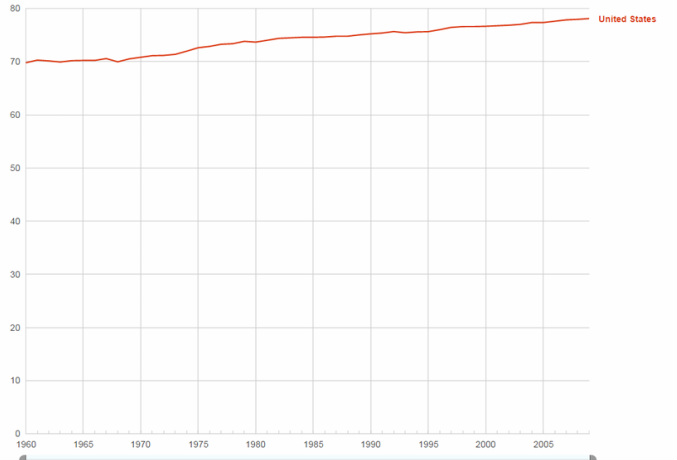
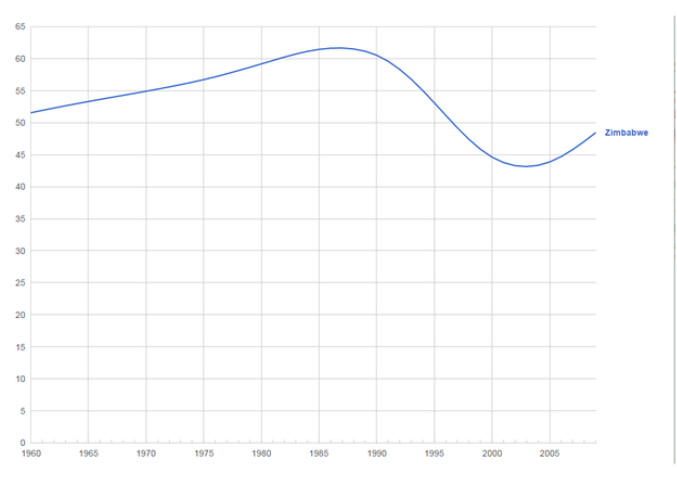
1. How do the the life expectancy (avg age a person may expect to live) in the U.S. from 1960-2010 compare to life expectancy in Zimbabwe?
Years
Years
United States (Quantitative Data)
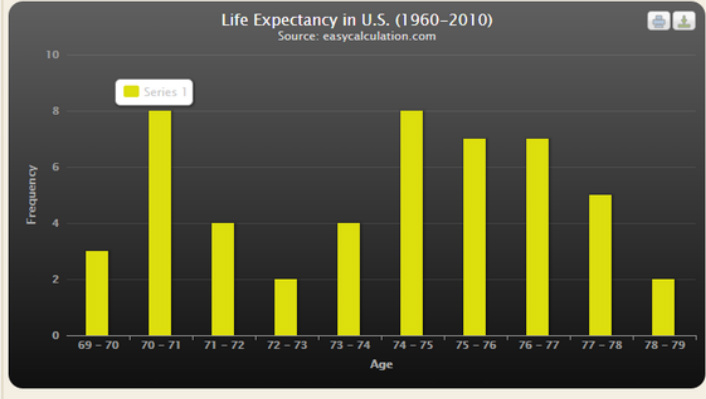
In the histogram, the graph is slightly skewed right, so the median and IQR should be used in determining the data. Median is around 74 years old. The graph is bimodal, with peaks of 70-71 and 74-75. Range is 9. IQR is 5.

Boxplot:
Five number summary: 69, 71, 74, 76, 78
Although it is slightly skewed, there are no outliers.
Five number summary: 69, 71, 74, 76, 78
Although it is slightly skewed, there are no outliers.
Zimbabwe (Quantitative Data)
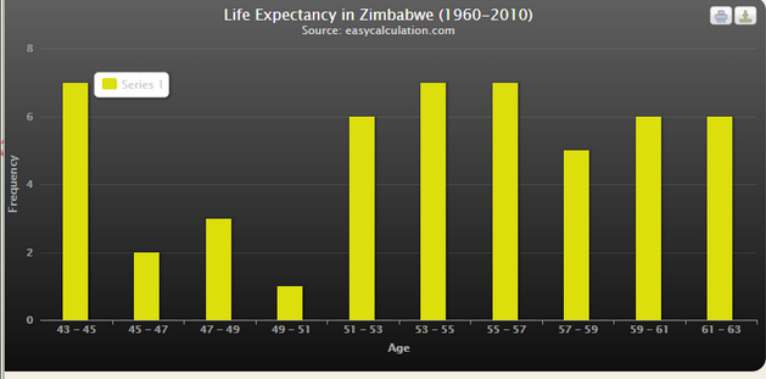
In the histogram, the graph is symmetrical, so the mean and standard deviation should be used in determining the data. Mean is approximately 53 years old. The graph is multimodal, with peaks of 43-45, 53-55, and 55-57 . Range is 18. Standard deviation is 5.9.

Boxplot:
Five number summary: 43, 48, 54, 58, 61
No outliers
Conclusion
From the data, the average life expectancy of U.S. from 1960-2010, a total of 50 years, is around 74 years old. While in Zimbabwe, the average age that a person would live until is around 54 years old, showing a difference of 20 years compared to the U.S.. The U.S. graph is slightly skewed to the right, but the Zimbabwe's graph is more symmetrical because the ages decreased starting from 1988. The five number summary for U.S. graph is 69, 71, 74, 76, 78, but the five number summary for the Zimbabwe graph is 43, 48, 54, 58, 61. The range of U.S. is 9 years, while range for Zimbabwe is 18 years. This indicates that Zimbabwe's life expectancy went through more changes than U.S.
In the year of 1988, Zimbabwe has shown a decrease of life expectancy, while U.S. has shown an increase of 1 year. These differences might be caused by various reasons such as epidemic across Southern Africa, economic crisis, and collapse of food production. The lack of outliers from both of the data shows that the life expectancy of citizens from both country did not significantly change over the 50 years period. Lastly,
-"Life Expectancy at Birth, Total (years)." Data. N.p., n.d. Web. 06 Oct. 2014.
-Statistics, National Center For Health. "National Vital Statistics Report." (n.d.): n. pag. Centers for Disease Control and Prevention. Sherry L. Murphy, B.S.; Jiaquan Xu, M.D.; and Kenneth D. Kochanek, 8 May 2013. Web. 7 Sept. 2014.
- "U.S. Life Expectancy and Mortality Rates: Latest Figures | Ecology Global Network." Ecology Global Network. N.p., n.d. Web. 08 Sept. 2014.
-"Zimbabwe Population Case Study." Cool Geography. N.p., n.d. Web. 16 Sept. 2014.
