Recap from Ch 1 and Ch 2 Project
Average age that a person may expect to live in the U.S.
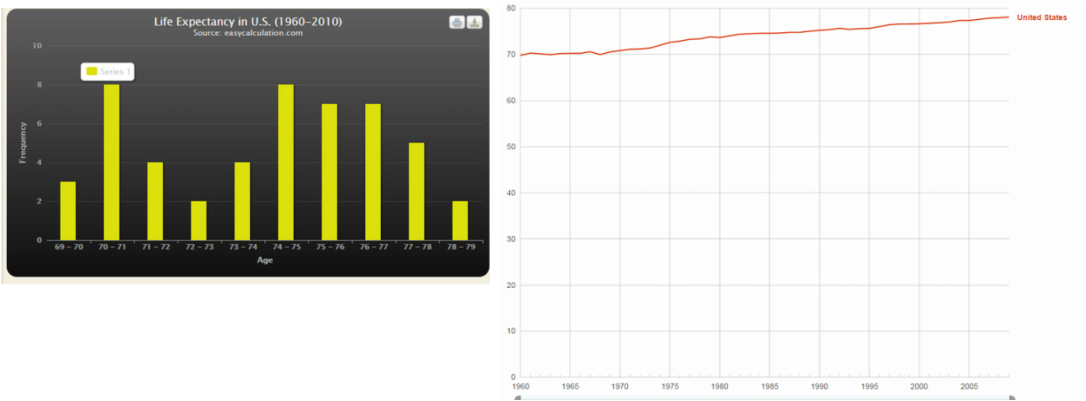

Five number summary: 69, 71, 74, 76, 78
The mean of the graph of U.S. life expectancy is 74 years old. It means that on average, from the years of 1960-2010, the age that a person in U.S. would live until is 74 years old. The standard deviation is 2.64 years. Although the graph and data has shown a small increase over each year, the life expectancy increased around 2.64 years every 10 years.
Z-scores corresponding to the 5-number summary
Z-scores corresponding to the 5-number summary
- Min: 69 corresponding z-score: -1.89. 97.1% of ages above or at 69
- Q1: 71 corresponding z-score: -1.14. 87.3% of ages above or at 71
- Median: 74 corresponding z-score: 0. 50% of ages above or at 74
- Q3: 76 corresponding z-score: 0.75. 23% of ages above or at 76
- Max: 78 corresponding z-score: 1.52. 5.7% of ages above or at 78
Average age that a person may expect to live in Zimbabwe
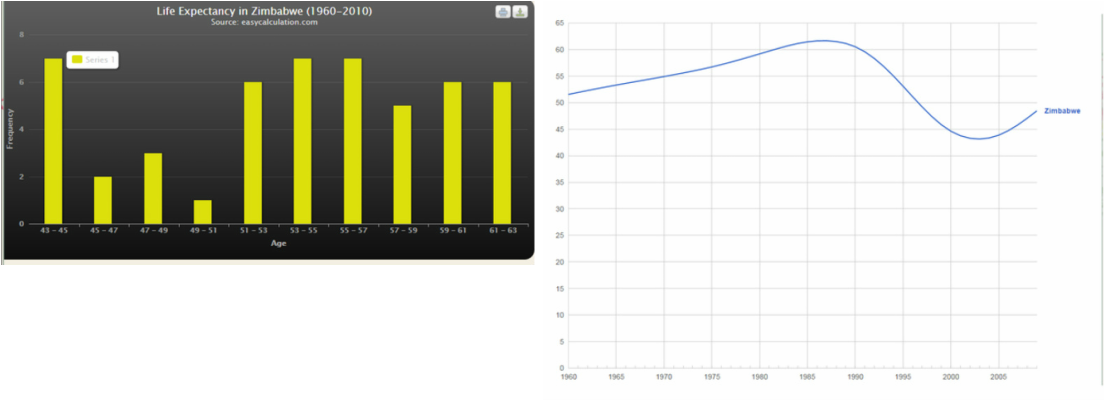

Five number summary: 43, 48, 54, 58, 61
The mean of the graph of the Zimbabwe life expectancy is 53 years old. It means that on average, from years 1960-2010, the age that a person in Zimbabwe would live until is 74 years. The standard deviation is 5.93 years. The amount of variation from the average of 43 years is around 5.93 years, which is more than the U.S. life expectancy standard deviation.
Z-scores corresponding to the 5-number summary
Z-scores corresponding to the 5-number summary
- Min: 43 corresponding z-score: -1.69. 95.5% of ages above or at 43
- Q1: 48 corresponding z-score: -0.84. 80% of ages above or at 48
- Median: 54 corresponding z-score: 0.17. 43.3% of ages above or at 54
- Q3: 58 corresponding z-score: 0.84. 20% of ages above or at 58
- Max: 61 corresponding z-score: 1.35. 9% of ages above or at 61
The two data points that showed the most significant difference between the life expectancy of U.S. and expectancy were during the year of 2003:
- U.S.: The average age that a person has lived in 2003 was around 74 years old. The z-score is 0, which means that 74 years is around the mean, the 50th percentile of life expectancy data in U.S. It means that 74 years of age is the average age that a person in U.S. would live from years 1960-2010.
- Zimbabwe: The average age that a person has lived in 2003 was only 43 years old. The z-score is -1.69, which means that 43 years is only around the 4th percentile of life expectancy data in Zimbabwe from 1960-2010. It means that 43 years old is below the majority of average life expectancies in the span of 50 years.
- In conclusion, the average life expectancy in the U.S. was approximately twenty years apart from the life expectancy in Zimbabwe. In 2003, Zimbabwe was experiencing one of the harshest AIDs and HIV epidemic in the world, and combined with poverty, the life expectancy dropped to only 43 years old. The data in 2003 showed the most significant difference between the two countries.
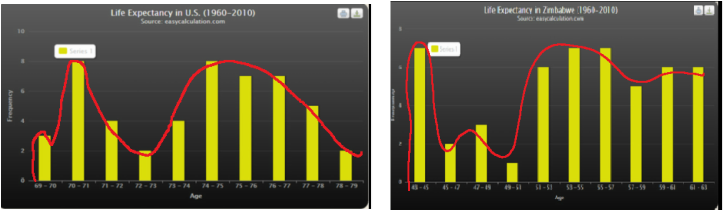
Density Curves ( U.S. vs. Zimbabwe)
Frequency (y-xis) |
Life expectancy: Ages (x-axis) |
- U.S. (left graph): The data set is not approximately normal because it does not show the characteristics of a normal graph when the mean is 0 and standard deviation is 1. The graph also slightly looks skewed to the right. The 68-95-99.7 rule does not apply to distribution that are not normal, so it could not be applied to the graph here to determine the specific values from my data set that fall within 1, 2, & 3 standard deviations from the mean.
- Zimbabwe (right graph): The data set is not normal because it appears to be more skewed to the right. It does not have a mean of 0 and standard deviation of 1, so therefore the 68-95-99.7 rule can not be applied to the graph since the data set is not normal.
